This page provides an overview of the Gamma Dose Rates Simple Map and highlights a few of the primary tools users will most likely want to interact with.
After clicking “Open the map” and acknowledging the limitations of use as listed on the Disclaimer page, the user will be able to access the simple European daily gamma dose rates (GDR) map.
This action requires a cookie to be enabled in the browser. If your browser is configured to block cookies, you may have to add an exception for the Simple Map.
The Map viewer can be accessed from any computer with an internet connection and does not require a licence or subscription.
It utilises a "responsive" design, meaning that its functionality and appearance is optimised for a wide range of devices, from desktop computers to smartphones.
By default, the map will show the latest Gamma Dose Rate aggregated averages of the approximately 5000 available stations,
and display them as hexagons coloured according to the highest average in the associated area.
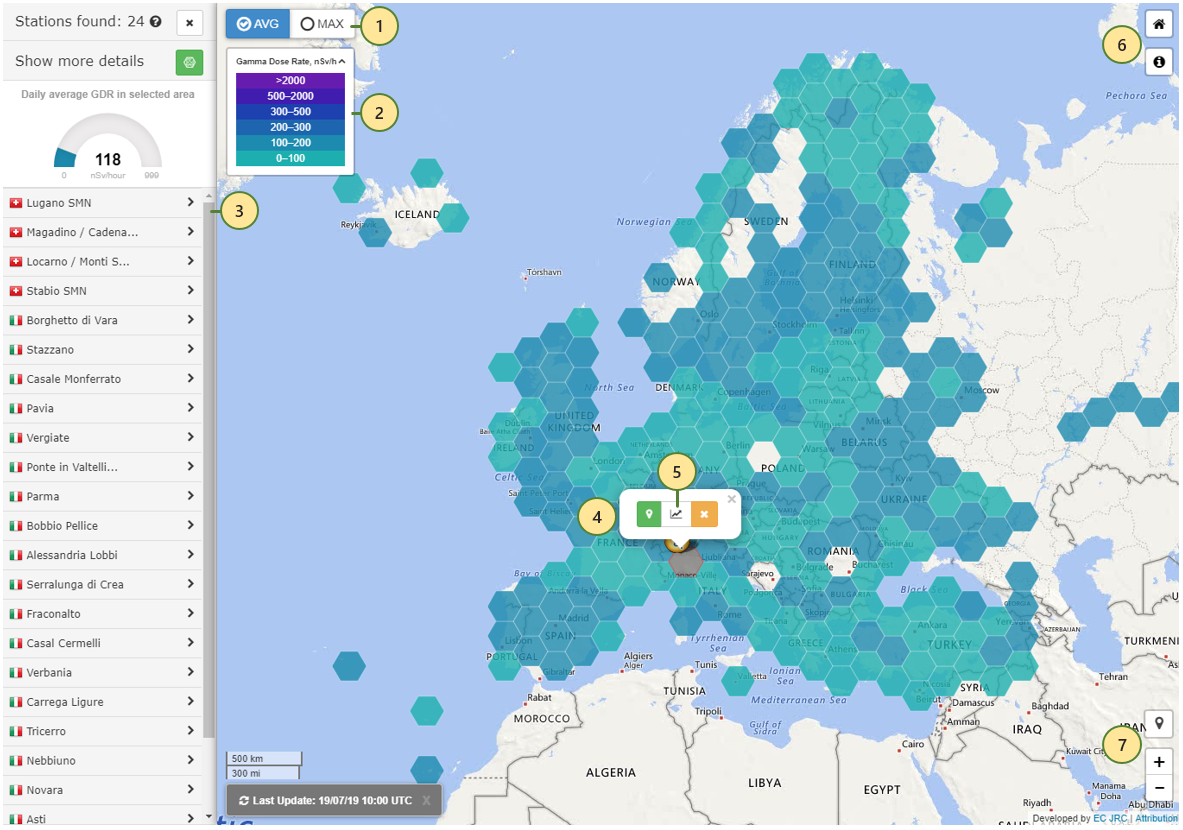 Simple Map Layout
- The options on the top-left of the map allow selection between average and maximum Gamma Dose Rate values, for the last 24 hours.
- The “Legend” area displays the threshold levels of each of the colours represented on the map.
- Clicking or tapping on a hexagon on the map will open the stations sidebar on the left side of the screen.
This contains the list of monitoring stations available in the selected area.
Clicking or tapping on a station opens the time series charts for that station (presented in the next section).
- Selecting a station in the sidebar also opens the quick-actions popup.
- The button in the middle allows quick access to the time series charts, while the other buttons are used to show the detailed map of the area (left), or close the popup (right).
- The buttons on the top-right corner of the map provide quick navigation to the home page (top), or this documentation (bottom).
- On the bottom-right, the geolocation button (top) allows zooming in on your present location on the map, as long as this functionality is enabled in the settings of your computer or mobile device.
The +/- buttons (bottom) increase or decrease the zoom level, complementary to the mouse scroll wheel or pinch gesture interactions.
Clicking or tapping on a station in the sidebar opens the accompanying time series window.
The most recent daily and hourly Gamma Dose Rate averages for that station are represented as line charts,
while the station's name and the country flag of the corresponding network are displayed at the top of the window.
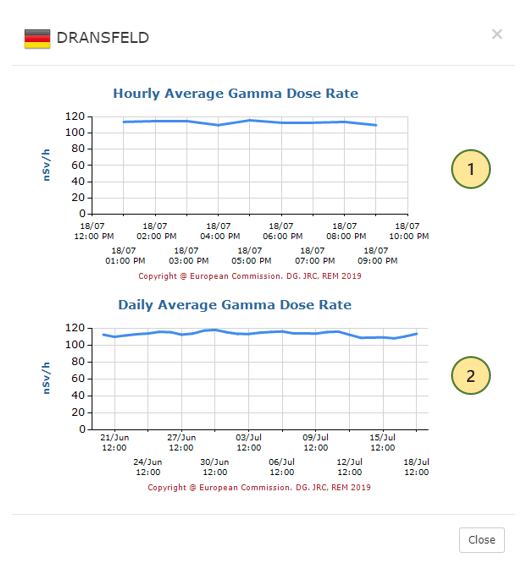 Simple Map Time Series
- Daily Gamma Dose Rate averages for the last 30 days
- Hourly Gamma Dose Rate averages for the last 24 hours
Please note that the hourly data may be absent or incomplete due to various reasons, such as instrument maintenance or repairs,
telecommunication disruptions, server unavailability on the site of the data provider, or other technical issues.
We do not take any responsibility for such events and the data misrepresentation they may lead to.
Detailed stations map
The detailed stations map appears when the sidebar button "Show more details" or the left button on the station quick-actions popup are clicked.
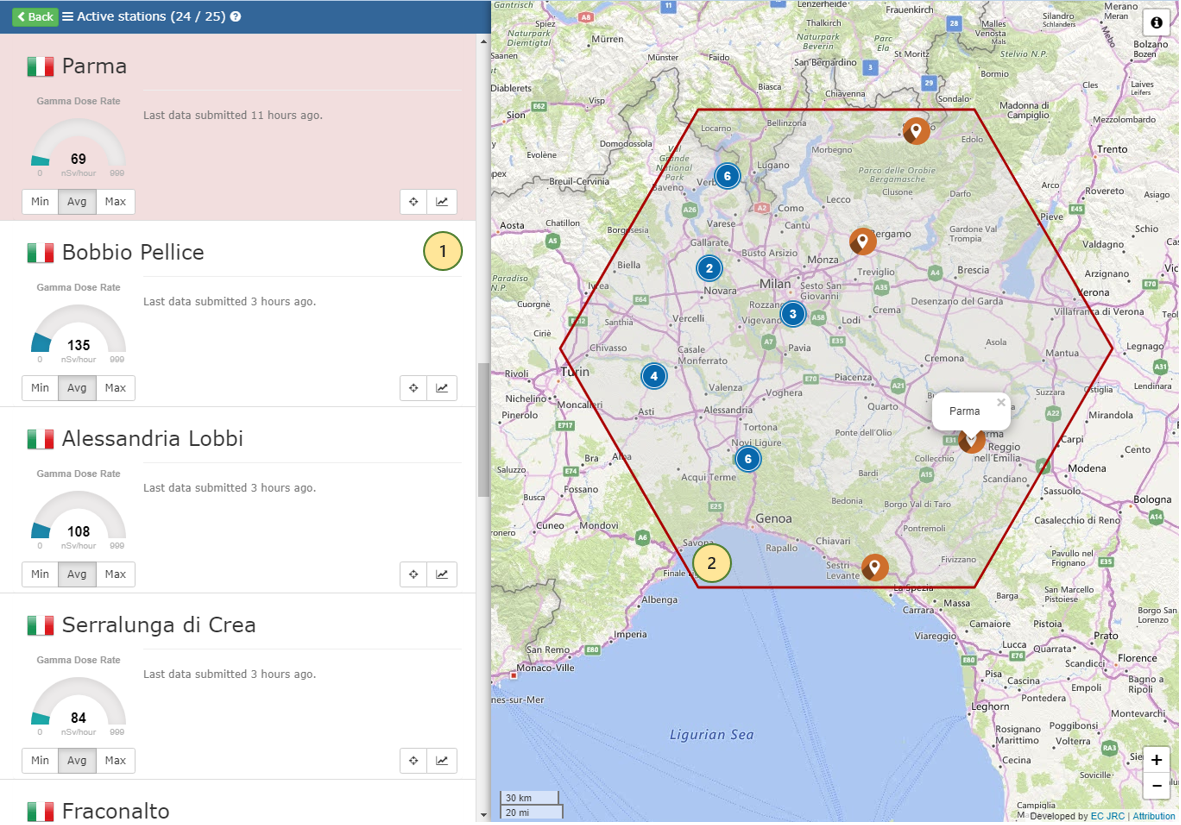 Detailed Stations Map
- List of Gamma monitoring stations active over the last 24 hours
- each station has an indicator displaying the minimum, average or maximum value for the last 24 hours.
The buttons on the right side may be used to locate the station on the map and to show the associated time series.
- The map shows all the monitoring stations, including those which didn't submit any data during the last 24 hours.
The blue circles represent clustered station markers and the number of stations in the cluster.
Clicking on the cluster expands it and shows all the corresponding stations.
Zooming in on the map de-clusters the stations in that area.